
Queue dashboard#
Vector has a queue dashboard, in the spirit of Laravel Horizon. It shows
the size of each queue and, with kinetis/queue-failed-jobs, the jobs
the worker gave up on, which can be browsed, retried, forgotten and
pruned. It can clear queues, and it records per-minute throughput,
failure and duration metrics. It is part of kinetis/vector and
@kinetis/vector-ui, built on
kinetis/queue, and it is
unrelated to Vector’s own background work (Background jobs): it reads the
application’s queues, whatever pushes to them.
Install#
There is nothing to install for the dashboard itself. It appears on its own, per user:
Queues is in the menu, beside Jobs, when the application’s queue is configured — a
QueueInterfacebound, whichkinetis/queuedoes whenQUEUE_CONNECTION(or the connectionQUEUE_CONNECTION_NAMEnames) is set, or yourbootstrap.phpbinds one — and the dashboard’s policy lets the user view (see below). The descriptor reports it ascapabilities.queues. Otherwise the entry and the dashboard card are left out, and every/vector/queuesendpoint answers404, as a path no route matches does.Failed jobs are part of it when, on top of that,
kinetis/queue-failed-jobs1.1 or later is installed, which binds its store and retrier:composer require kinetis/queue-failed-jobsThe descriptor reports it as
capabilities.failedJobs. Without it the Failed jobs tab, the overview’s Failed column and the card’s failed figure are left out, the overview’sfailedisnull, the permissions name no failed-job action, and the/vector/queues/failedendpoints answer404. Vector only suggests the package: it boots and serves the rest of the dashboard without it.
Recording metrics is on in every process that runs queue:work, failed
jobs or not, unless VECTOR_QUEUE_METRICS turns it off (see
Configuration below).
Migrations#
The metrics live in vector_queue_metrics, one of Vector’s own tables,
on Vector’s own connection (VECTOR_DB_CONNECTION, the default
connection when unset) beside vector_jobs and the rest.
vendor/bin/kinetis vector:install publishes its migration with the
others (Getting started); run it again after upgrading, then
vendor/bin/kinetis migrate. On MySQL it needs 8.0.19 or later:
every write is one INSERT … AS incoming ON DUPLICATE KEY UPDATE, and
the row alias arrived in 8.0.19. Postgres uses
INSERT … ON CONFLICT … DO UPDATE.
Failed jobs live in kinetis_failed_jobs, where
kinetis/queue-failed-jobs keeps the jobs the worker gave up on. Copy
the stub for your database from
vendor/kinetis/queue-failed-jobs/resources/migrations/
(create_kinetis_failed_jobs_table.mysql.php.stub or
….pgsql.php.stub), as that package’s README describes, into
migrations/, or migrations/<name>/ when
FAILED_JOBS_DB_CONNECTION_NAME names a connection. The dashboard reads
them through a link of its own on that same connection, default when
the name is unset or blank, the one kinetis/queue-failed-jobs records
on.
kinetis_failed_jobs holds each job’s arguments in full, #[Sensitive]
values included, because a retry rebuilds the job from them. Give it the
access controls the queue’s own storage has. The dashboard never shows a
sensitive value (see below).
Configuration#
VECTOR_QUEUES=default,mail,reports
VECTOR_QUEUE_METRICS=true
These are the queues the dashboard watches, comma-separated, listed in
the order the overview shows them. Set it to the names your worker
serves (queue:work --queue=default,mail,reports). A worker’s
--queue list is its own command-line argument, which no HTTP process
can see, so when VECTOR_QUEUES is unset or blank the dashboard watches
default only. Each name must follow kinetis/queue’s grammar
(letters, digits, - and _, up to 80 characters), or the application
does not boot.
Only these names are accepted. Any other queue is a 404 in a path and
a 422 in a filter, and failed jobs on other queues are not listed,
shown, retried or forgotten. Sizes and clears go to the application’s
bound QueueInterface.
VECTOR_QUEUE_METRICS turns the job metrics on or off. Unset or blank,
they are on. false, 0, off or no turns them off, and true, 1,
on or yes keeps them on. Any other value stops the boot. Each worker
reads it once, when it boots, so restart the HTTP workers and every
queue:work after changing it. While it is off, no attempt is recorded
and nothing is opened to record one: the listener never builds the
metrics store or its database link, so a missing vector_queue_metrics
logs no warning. GET /vector/queues/metrics answers 404,
capabilities.queueMetrics is false, and the page shows no Metrics
tab. The table and its migration stay. vector:queues:prune-metrics
still works, so you can delete what was recorded before.
Who may do what#
Every endpoint is in Vector’s vector middleware group, so the
application’s authentication and VectorAccessInterface run first. An
unauthenticated call gets what that group answers, a 401. Then
Kinetis\Vector\Queues\Auth\QueueDashboardPolicyInterface decides each
call. A refused view hides the whole dashboard from that user: the
descriptor’s capabilities.queues is false and every endpoint answers
404. Any other refusal is a 403:
Method |
Decides |
|---|---|
|
The overview, the failed list and detail, the metrics and the permissions. |
|
Pushing failed jobs back onto their queue. |
|
Deleting one failed-job record without retrying it. |
|
Deleting every failed-job record older than an age. |
|
Discarding every job waiting on |
The policy is asked before the request is validated and before any
database or queue connection is opened; only a clear’s queue name is
checked first, and a name outside the queue-name grammar is a 404
before the policy runs. A refused caller learns nothing about which
queues exist. The policy runs for an unwatched queue’s clear too, ahead
of its 404.
Vector binds ViewOnlyQueueDashboardPolicy: anyone Vector admits
may look, and nobody may retry, forget, prune or clear. Every viewer
sees a failed job’s exception class and message. The store keeps no
stack trace, so the detail’s exception.trace is always null. Job
arguments pass through JobSerializer::redact(): a #[Sensitive]
constructor parameter shows as [redacted], and so does every argument
when the job class no longer loads.
To let someone change things, bind your own policy in bootstrap.php.
It runs after Vector’s bootstrap, so its binding wins:
use Kinetis\Vector\Auth\ActorContext;
use Kinetis\Vector\Queues\Auth\QueueDashboardPolicyInterface;

final readonly class AdminQueuePolicy implements QueueDashboardPolicyInterface
{
    public function view(ActorContext $actor): bool { return true; }
    public function retry(ActorContext $actor): bool { return self::admin($actor); }
    public function forget(ActorContext $actor): bool { return self::admin($actor); }
    public function prune(ActorContext $actor): bool { return self::admin($actor); }

    // per queue: an admin may empty a scratch queue but not the mail queue
    public function clear(ActorContext $actor, string $queue): bool
    {
        return self::admin($actor) && $queue !== 'mail';
    }

    // AppUser stands for your own user class, as the Vector actor carries it
    private static function admin(ActorContext $actor): bool
    {
        return $actor->user instanceof AppUser && $actor->user->isAdmin;
    }
}

$app->instance(QueueDashboardPolicyInterface::class, new AdminQueuePolicy());
One instance answers every request a worker handles, so a policy holds
no request state. The demo’s App\Auth\DemoQueueDashboardPolicy lets
admins mutate (The demo application).
Every retry, forget, prune and clear writes to Vector’s audit trail
(Audit trail and impersonation) under the resource vector-queues (prefixed to keep it apart from your own resources), with the actor and any
impersonator. No entry carries a job argument.
The admin page#
The admin’s Queues page, at /queues, sits beside Jobs in the
menu, with up to three tabs:
Overview: each watched queue’s waiting jobs and, with failed jobs, its failed count, refreshed every five seconds while the page is visible, with Clear where the policy allows it.
Failed jobs, with failed jobs only: the list with its filters, a Load more that follows the server’s cursor, and each job’s detail. Retry works on one job or a selection of up to 50; Forget and Prune (by age in days) are offered where the policy allows them.
Metrics, unless
VECTOR_QUEUE_METRICSis off: a queue and a window from 15 minutes to 7 days, the totals, a sparkline of attempts per minute (neighbouring minutes summed into at most 240 points on windows longer than 4 hours), and tables per queue and per job class.
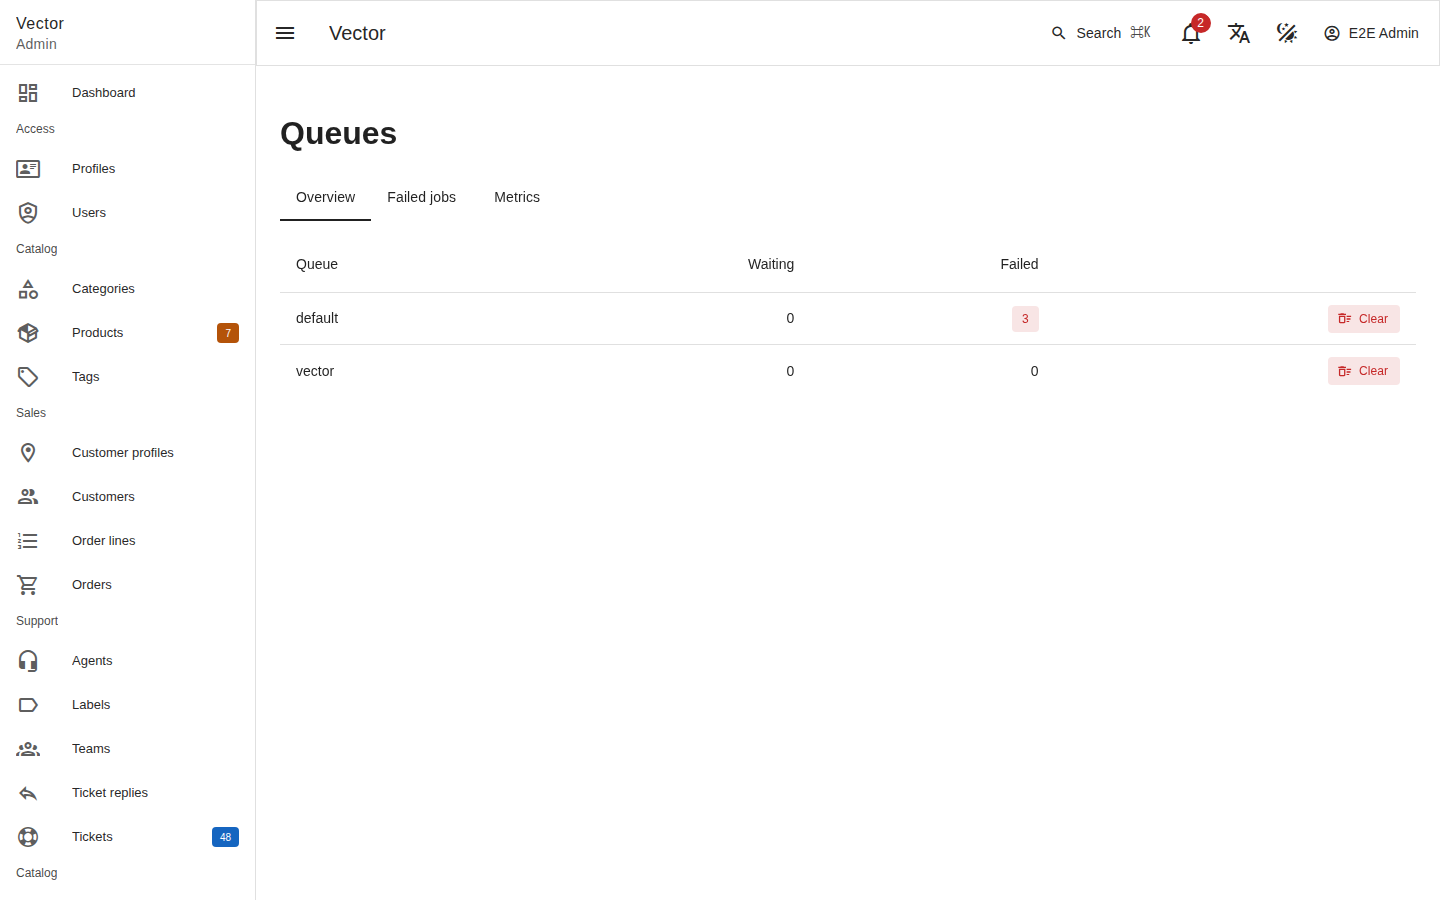
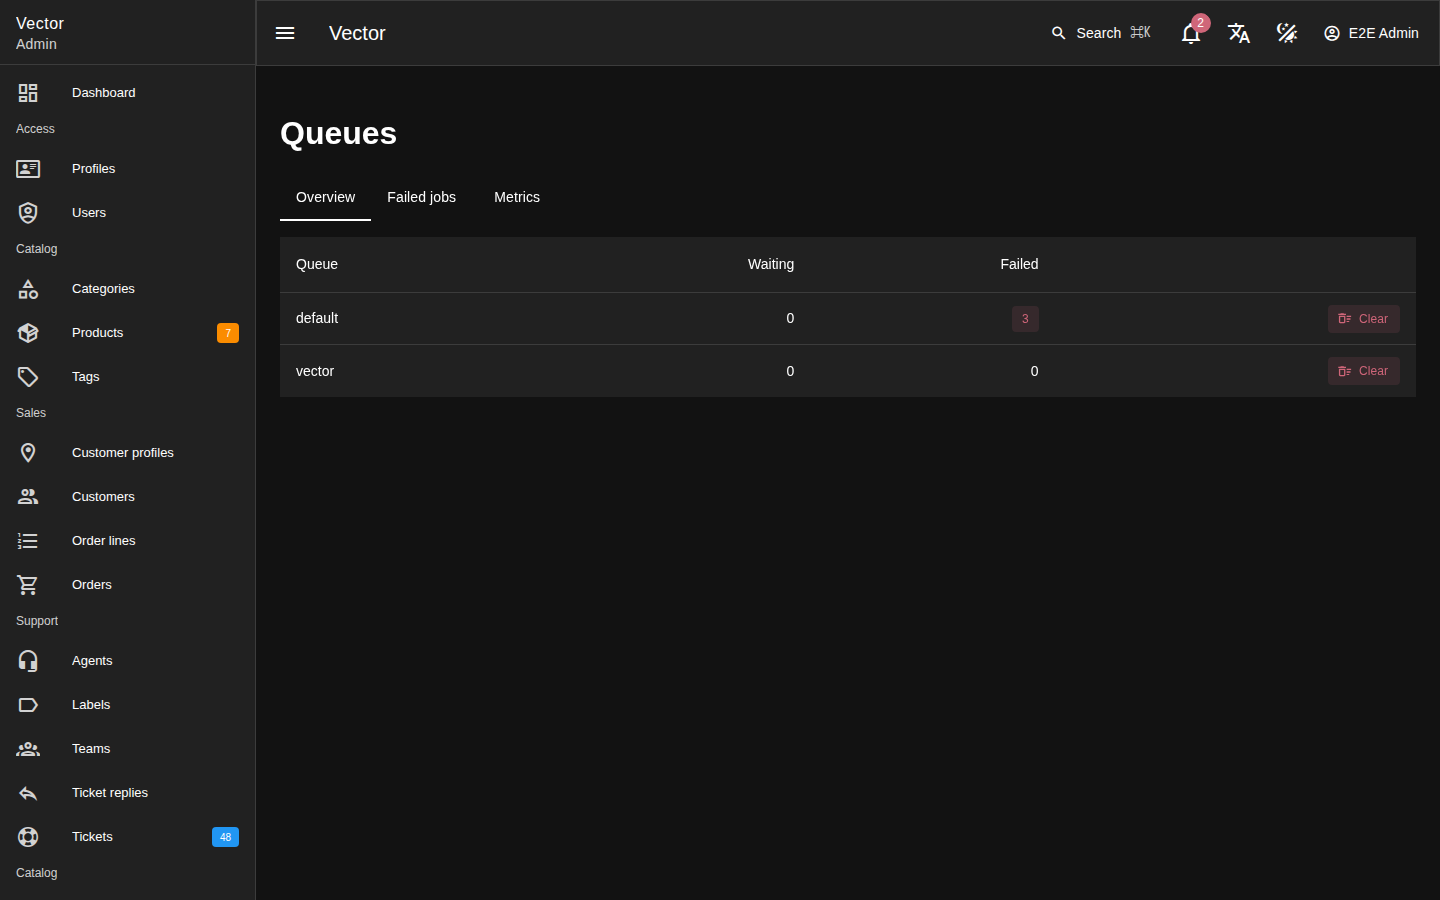
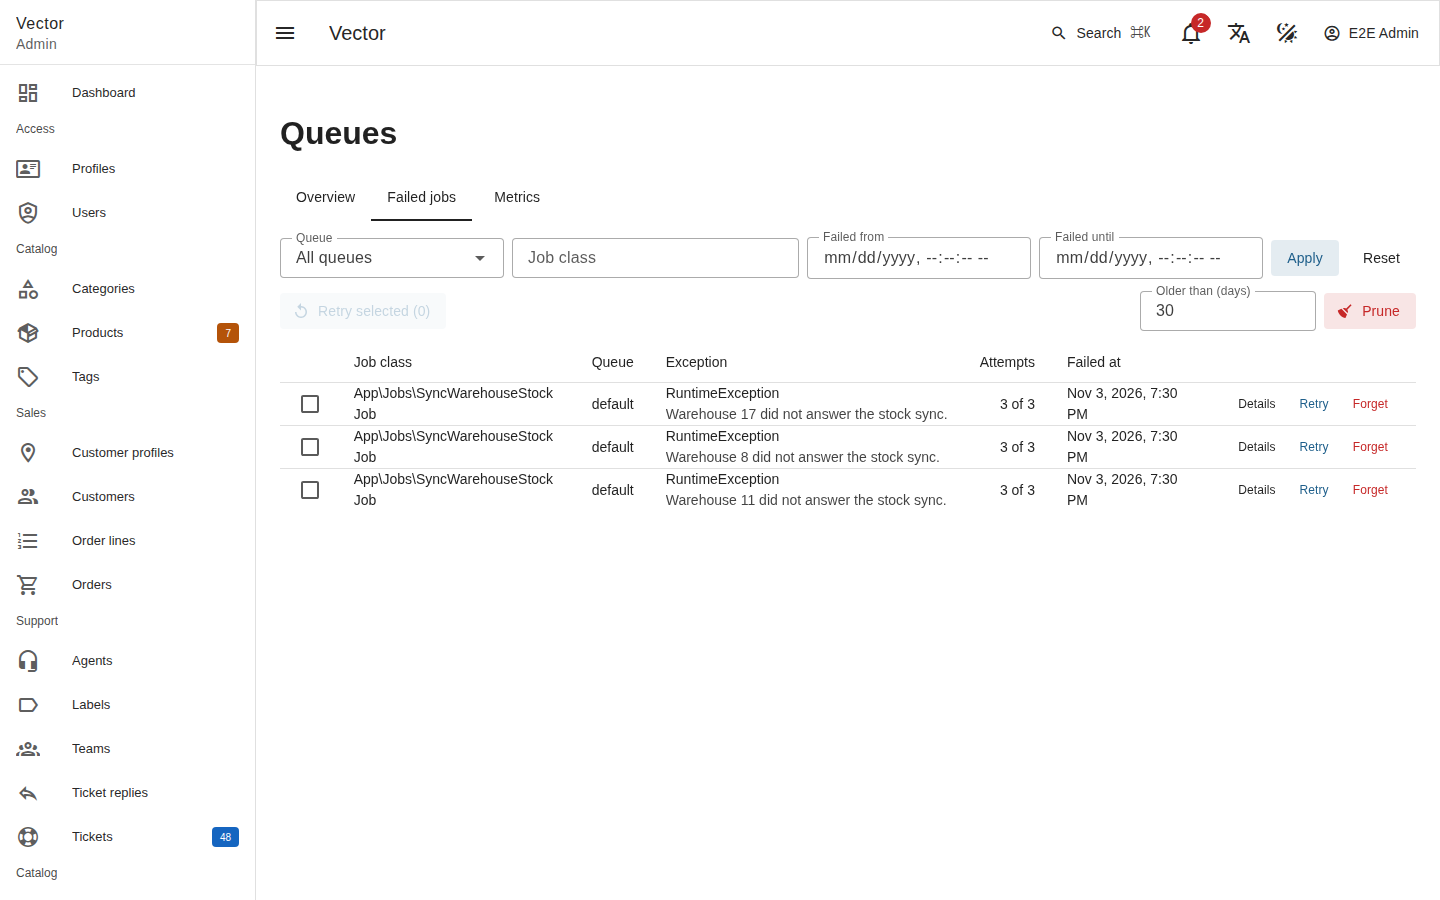
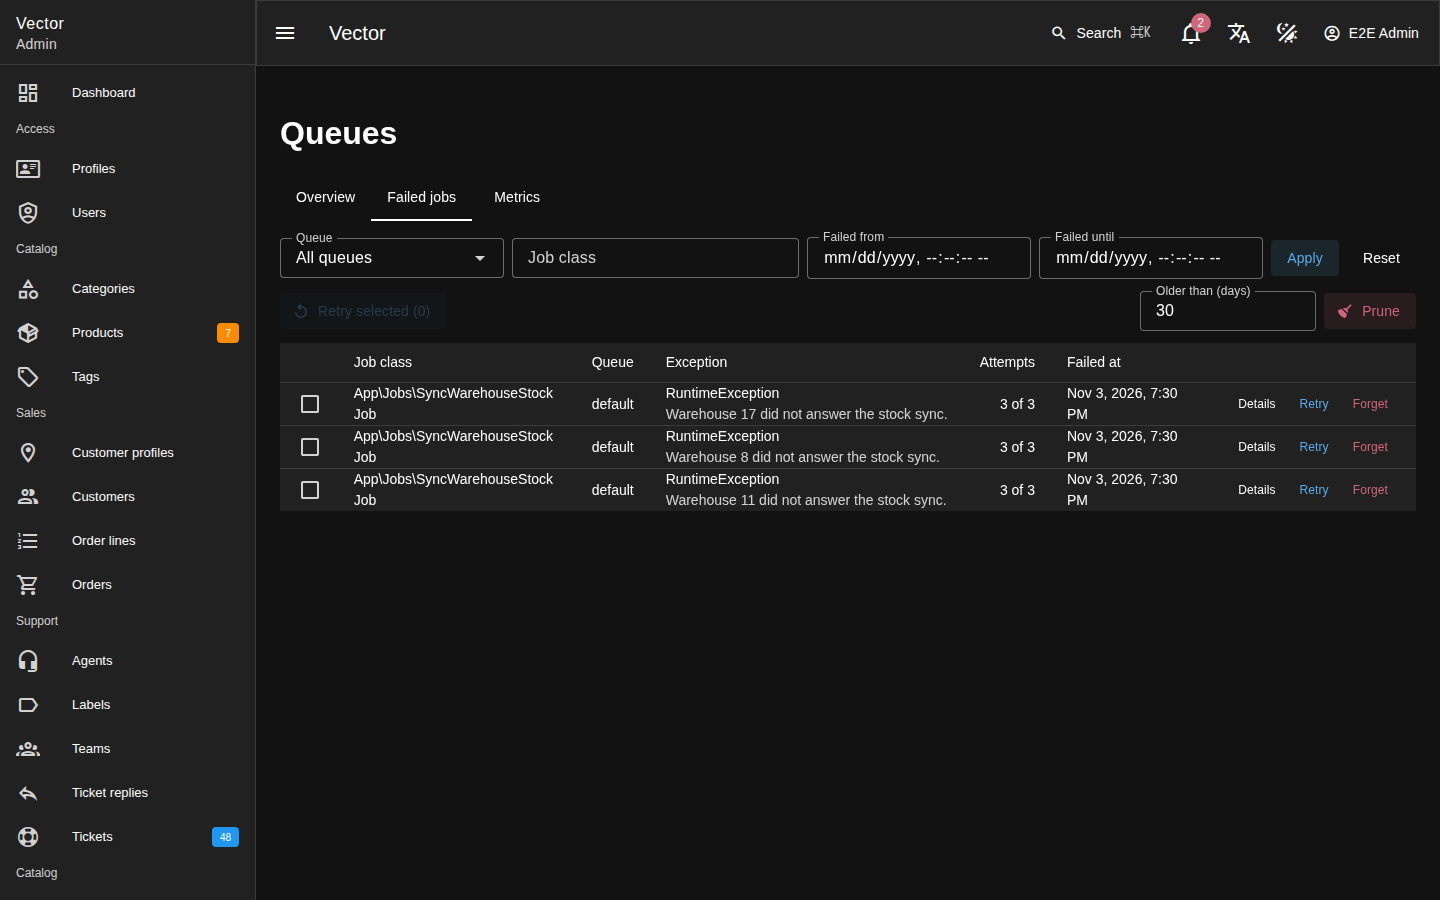
The page reads GET /vector/queues/permissions and leaves out every
action the policy refuses. That only shapes the page: every endpoint
asks the policy again. Each action asks for confirmation first, and
Clear only once the queue’s name is typed into it. The
page’s text ships in every language Vector’s UI ships, as machine
translations, in the layer’s queues messages; override any of it in
app config vector.messages or with defineMessages under queues
(Languages). English is the fallback. Server text such as
exception messages is rendered as text, never as HTML, and unredacted:
any viewer sees a failed job’s exception message as the job threw it, so
keep secrets out of exception messages.
The label the dashboard declares on the server, the card’s Queues,
is translated in the same languages by Vector’s own translations. Your
VECTOR_TRANSLATIONS_DIR overrides it: give the key Queues a wording
of your own there.
The dashboard card#
Kinetis\Vector\Queues\Widgets\QueuesWidget is a dashboard card: the
jobs waiting and, with failed jobs, failed across the watched queues,
with a link to the page. Vector places it on no dashboard. List it in
one of your own:
use Kinetis\Vector\Queues\Widgets\QueuesWidget;

#[Dashboard]
final class MainDashboard extends VectorDashboard
{
    public function widgets(): array { return [RevenueStat::class, QueuesWidget::class]; }
}
Its name is queues and so is its type, a built-in widget type
(Dashboards and widgets) whose card the admin UI ships. It is viewable
exactly where the dashboard is: where capabilities.queues is false the
dashboard leaves it out. The card reads GET /vector/queues itself, so
the policy decides what it shows. The widget’s own answer, GET /vector/dashboards/{name}/widgets/queues, carries no queue data and
opens no database or queue connection. It offers no range and caches
nothing.
Endpoints#
All answers are JSON, under /vector/queues. Each is a 404 when the
dashboard is not there for the caller (capabilities.queues false), and
each /failed one is a 404 without failed jobs
(capabilities.failedJobs false). /metrics is a 404 while
VECTOR_QUEUE_METRICS is off (capabilities.queueMetrics false):
Method and path |
What it does |
|---|---|
|
|
|
What the policy lets the caller do: |
|
Failed jobs, newest first: |
|
One failed job, its arguments redacted as above. |
|
|
|
Forgets one record: |
|
|
|
|
|
Job metrics over a window; see below. |
A clear answers in a fixed order: 404 when the dashboard is not there,
404 for a name outside the queue-name grammar, 403 when the policy refuses, 404 for an unwatched queue, 422 for a wrong confirmation, 409 for a
backend that cannot clear.
Pruning failed jobs spans every queue. It goes through the store’s
own prune(), which deletes every record older than the age given,
including records on queues the dashboard does not watch.
Metrics#
A listener records every attempt the worker settles, into
vector_queue_metrics on Vector’s own connection: kinetis/queue’s
JobSucceeded, JobReleased and JobFailedPermanently events. Each
attempt is one atomic upsert into a row per minute, queue and job class,
so concurrent workers never lose an increment. A row holds the
succeeded, released and failed counts, the summed and longest
handler durations and the last time a job was processed. Recording never
affects a job. A failed write, for example a missing table or a database
that is down, is logged as a warning at most once a minute per worker
and dropped.
With VECTOR_QUEUE_METRICS off, the listener returns before it touches
the database, and nothing is recorded or logged.
GET /vector/queues/metrics reads a window of it, on the watched queues
only:
from,to: unix seconds, each taken to the start of its minute, both minutes included.todefaults to now andfromto 59 minutes beforeto, so the default window is the last 60 minutes. A window spans at most 7 days (10 080 minutes).queue: one watched queue;class: one fully qualified job class.
The answer has buckets (one per minute, zero-filled), and queues and
classes (what ran in the window): counts, failureRate
(failed / (succeeded + failed), or null when nothing finished),
average and longest duration in milliseconds, and lastProcessedAt.
Nothing prunes the table on its own. Run the prune command from your scheduler, such as cron or a scheduled container task. Kinetis does not schedule commands itself:
vendor/bin/kinetis vector:queues:prune-metrics --days=7
It deletes the rows whose minute began more than --days days ago (a
whole number from 1 to 36 500, 7 when absent) and prints how many it
deleted. Any other --days exits with code 1 and deletes nothing. Once a
day is enough. The metrics for a window older than that are then gone.
In the demo#
The demo installs kinetis/queue-failed-jobs, binds
DemoQueueDashboardPolicy and watches VECTOR_QUEUES=default,vector,
the two queues its worker serves. To put real rows in the Failed and
Metrics tabs, queue its flaky job:
docker compose exec app vendor/bin/kinetis demo:queue-flaky --count=20 --failure=40
Each App\Jobs\SyncWarehouseStockJob goes on default with up to three
attempts and fails the given share of them, so the metrics show releases
and failures, and a job that runs out of attempts lands in Failed
jobs. Its apiKey argument is #[Sensitive], so its detail shows it
as [redacted]. Add --delay=<seconds> (up to 900) to hold the jobs
back first and watch them wait. See The demo application.
See also#
Background jobs: Vector’s own background jobs, on a queue this dashboard can watch too.
Dashboards and widgets: placing the card, and the other widget types.
Authorization: Vector’s own access checks, which run before the dashboard’s policy.